In 1930, in an essay entitled Economic possibilities for our grandchildren, economist John Maynard Keynes predicted that in a century’s time, Gross Domestic Product (GDP) would be four to eight times greater and by 2010 the average workweek would be 15 hours1. The great challenge would be to fill up people’s leisure time with meaningful activities.
While the first half of Keynes’s prediction has come true, the corresponding quality of life improvement has never come close. As the figure below clearly indicates, GDP per capita in Canada has been rising much faster than wellbeing as measured by the CIW. In the 21-year period from 1994 to 2014, GDP grew by 38.0% while the Canadian Index of Wellbeing (CIW) rose by only 9.9% (see Figure 1). Up to the recession of 2008, GDP grew by 29.9% and the CIW by 8.8%. Since the recession, GDP, after faltering, has grown by another 8.1% whereas our wellbeing has grown by barely 1.1%. The gap between these measures reveals a deeper issue: GDP alone cannot measure how well our population is faring as a whole2.
Increasingly, citizens and their government are thinking “beyond GDP” as a measure of our progress and quality of life. Even though GDP is an important measure of our economic performance, it does not capture those areas of our lives that we care about most, like education, health, the environment, and the relationships we have with others. GDP also is not sensitive to the costs of economic growth such as environmental degradation, loss of farmland, or growing income inequality.
Core values and domain identified by Canadians
Since its inception in 1999 and throughout the development of the CIW, the process has been designed to ensure everyday Canadians hear their own voices and see themselves reflected in the measure.
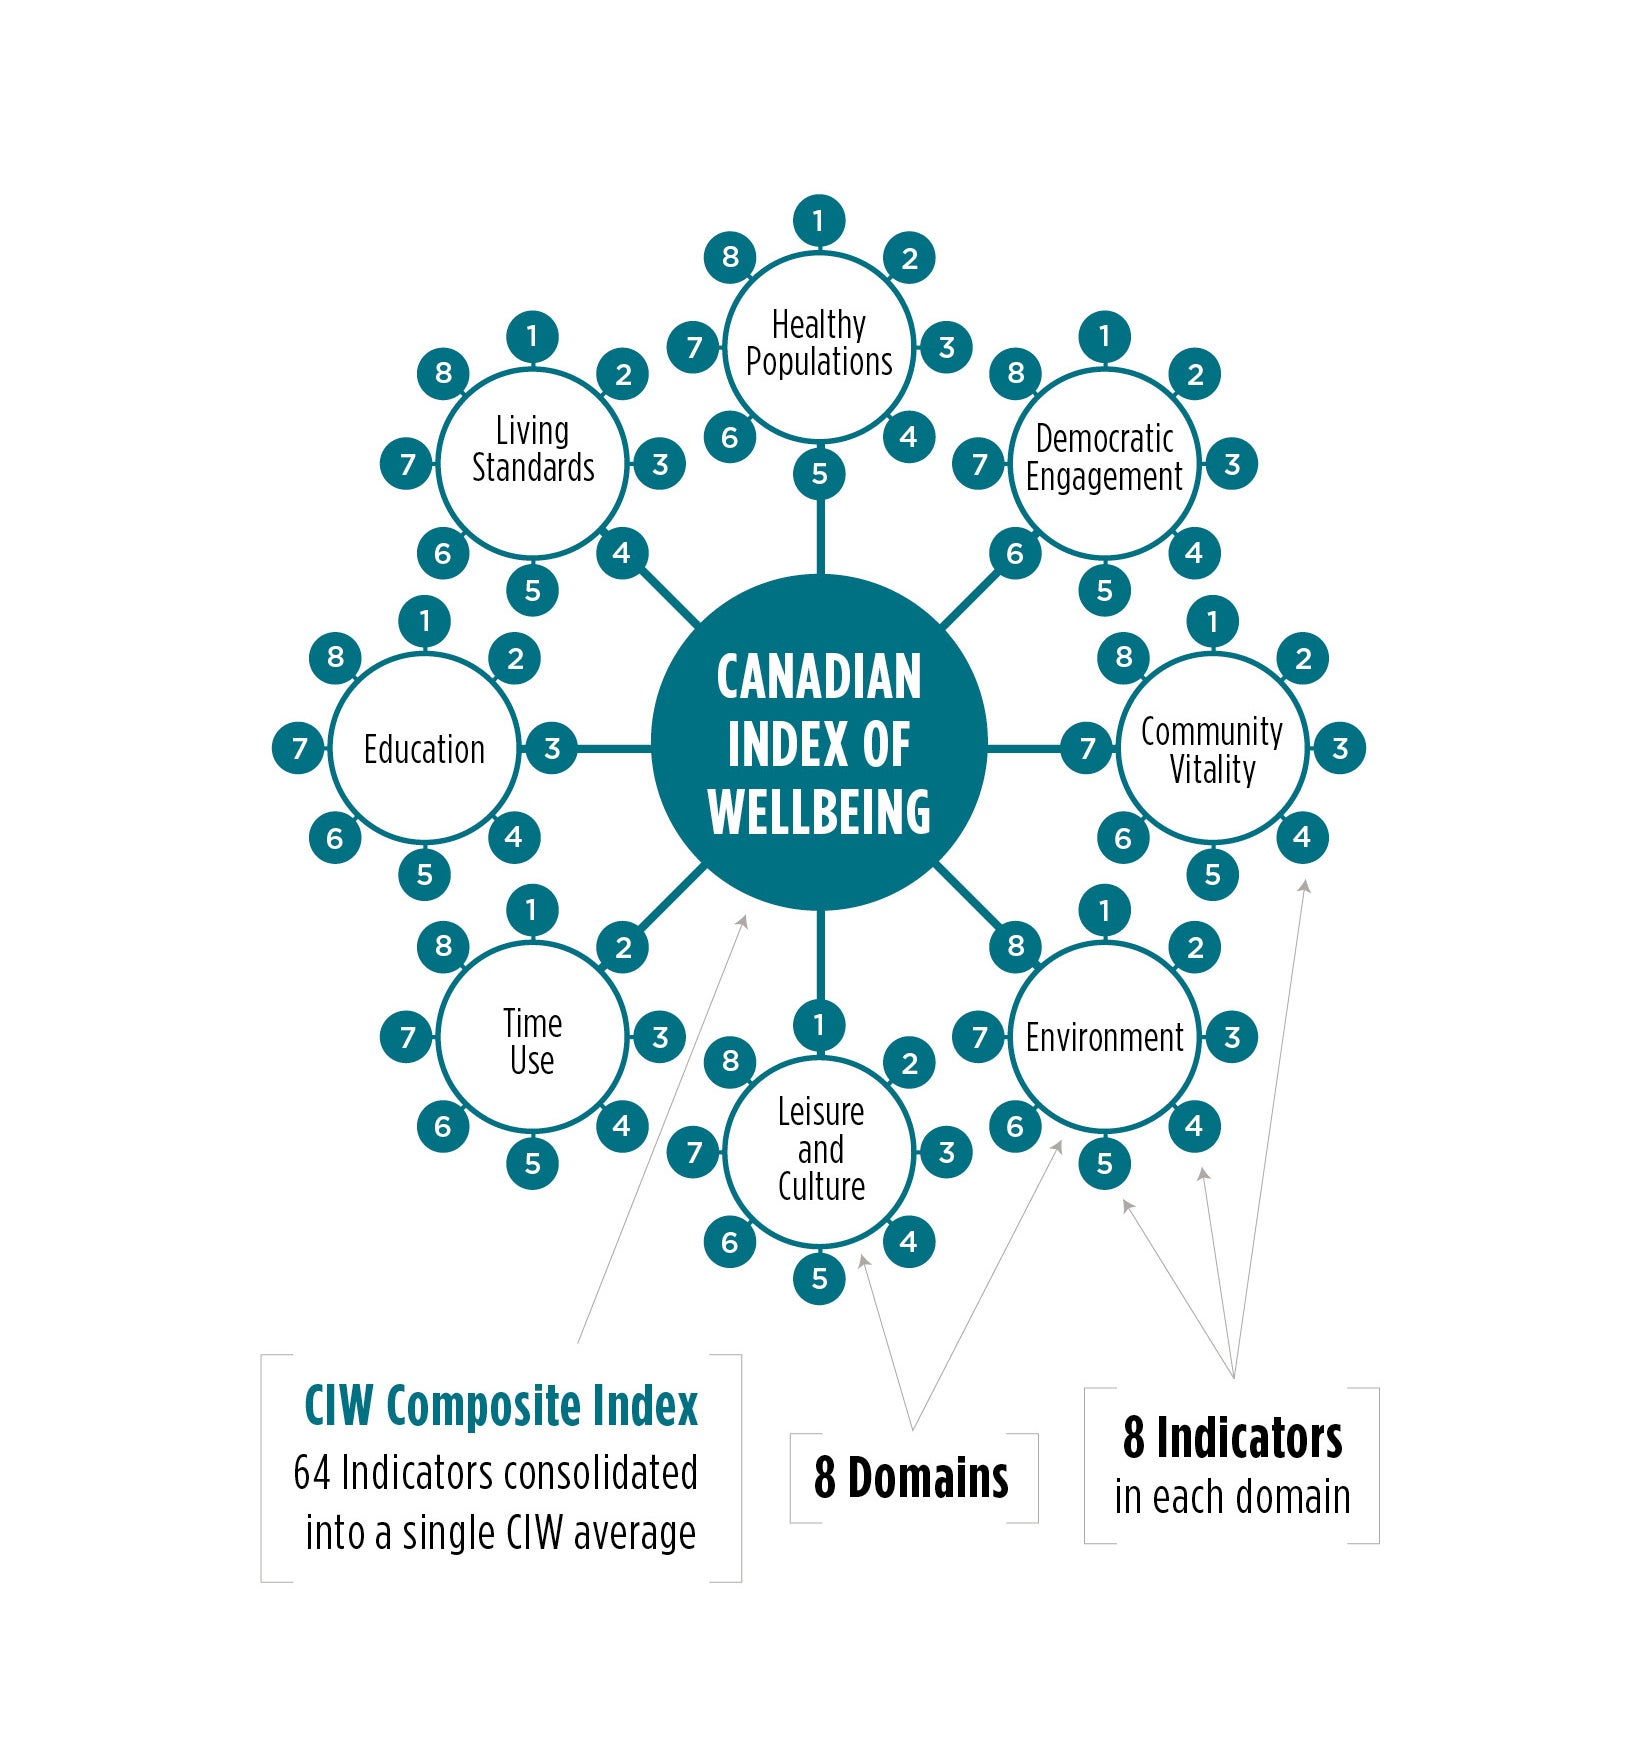
The CIW was created through the combined efforts of national leaders and organizations, community groups, research experts, indicator users, and importantly, the Canadian public. Through three rounds of public consultations, everyday Canadians across the country candidly expressed what really matters to their wellbeing. The process culminated in the identification of core Canadian values and eight domains of life that contribute to and affect the wellbeing of Canadians: Community Vitality, Democratic Engagement, Education, Environment, Healthy Populations, Leisure and Culture, Living Standards, and Time Use (see Figure 2). This framework shifts the focus solely from the economy to what matters most to Canadians.
Community Vitality means vital communities that have strong, active, and inclusive relationships among people, private, public, and non-governmental organizations that foster individual and collective wellbeing.
Democratic Engagement means being involved in advancing democracy through political institutions, organizations, and activities.
Education is the systematic instruction, schooling, or training given to the young in preparation for the work of life, and by extension, similar instruction or training obtained in adulthood.
Environment is the foundation upon which human societies are built and the source of our sustained wellbeing. On a broader level, environmental protection involves the prevention of waste and damage while revitalizing our ecosystems and working towards the sustainability of all our resources.
Healthy Populations considers the physical, mental, and social wellbeing of the population. It examines life expectancy, lifestyle and behaviours, and the circumstances that influence health such as access to health care.
Leisure and Culture considers how participating in leisure and cultural activities, whether arts, culture, or recreation, contributes to our wellbeing as individuals, to our communities, and to society as a whole. The myriad of activities and opportunities we pursue and enjoy benefit our overall life satisfaction and quality of life.
Living Standards examines Canadians’ average and median income and wealth; distribution of income and wealth including poverty rates, income fluctuations and volatility; and economic security, including the labour market, and housing and food security.
Time Use considers how people experience and spend their time. It examines how the use of our time affects physical and mental wellbeing, individual and family wellbeing, and present and future wellbeing.
Together, these eight domains provide a more complete picture of wellbeing, incorporating a comprehensive set of the key social, health, economic, and environmental factors contributing to overall quality of life. Teams of nationally and internationally renowned experts then identified eight valid, reliable, and relevant indicators within each domain that are directly related to wellbeing. By integrating the 64 indicators and eight domains and revealing their complex interconnections, the CIW composite index provides a comprehensive portrait of quality of life in Canada.
The CIW composite index tracks all indicators and domains of wellbeing to measure our progress over time, highlighting where we are doing well and where we could be doing better.
An ongoing cycle of public engagement, consultation, and refinement is one of the defining characteristics of the CIW. It ensures that the Index is rooted in Canadian values, grounded in community experience, shaped by technical expertise, and responsive to emerging knowledge. The CIW is not a static measure. As new issues emerge and new knowledge, understandings, and data become available, the CIW adapts to strengthen its measure of wellbeing without veering from the values on which it is grounded. Hence, validating and continually improving the CIW is an ongoing process.
In this report, we describe trends in wellbeing from 1994 to 2014 based on the most valid and updated indicators of wellbeing in each of the domains.
1. Keynes, J.M. (1930/1963). Economic possibilities for our grandchildren. In J.M. Keynes, Essays in persuasion (pp. 358-374) London: Macmillan.
2. For a description of GDP, as well as some of the myths surrounding it, see Appendix A.